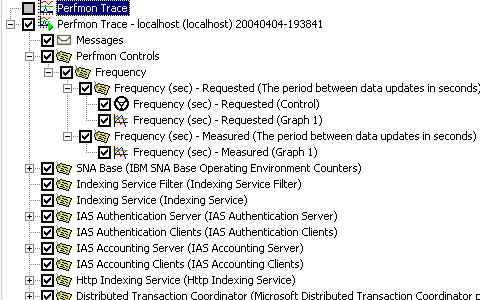
Note: in the case of a performance trace node, only the
highest level performance objects are initially displayed. These highest level performance
object are typically not actually metrics, but rather containers for related
metrics. To expose the actual metrics recursively request the children
of a particular performance object until its metrics are displayed. To request
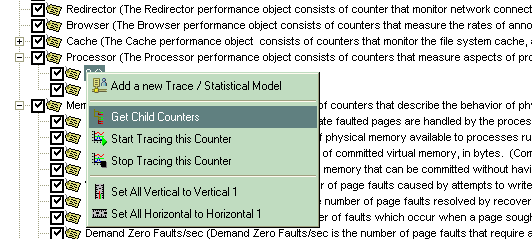
the children of a performance object, select Get Child Counters from its
pop-up menu and then wait for the "+" symbol to appear beside the
performance object in the tree to indicate that its children have been
retrieved.

- Frequency (sec)
Requested (Control)
Frequency with which the Perfmon performance objects are updated. - Frequency (sec)
Requested (Graph 1)
Frequency against the designated scale in the Graphs tab area. - Frequency (sec)
Measured (Graph 1)
Display actual frequency achieved against the designated scale in the Graphs tab area